
Air-quality data from where people actually breathe.
Skyly is a nine-parameter wearable sensor and data platform. It turns citizens, schools and vehicles into a mobile monitoring network that complements the stations cities already run.
Move across the sky: the air clears around you, your breathing zone. Particle density follows the PM2.5 of the selected city.
The air right now, in five cities.
Today's air, one click away.
Hourly values from the Copernicus atmosphere model, set against the WHO guideline levels. Pick a city to explore the next 48 hours.
Hourly city values are not available at the moment. For up-to-date readings, open one of these independent services.
PM2.5 · ranked, µg/m³
PM2.5 · 72 hours
Modelled values (Copernicus CAMS ensemble, served by Open-Meteo.com, CC BY 4.0) on a grid of roughly 11 km, in each city's local time. They are not Skyly measurements and not official station readings. Hourly values are compared with WHO 2021 guideline levels for orientation only (24-hour levels; ozone: 8-hour).
A model describes an area. You breathe on a street.
See the gap ↓The biggest environmental health risk is still invisible.
Air quality is usually measured by a few fixed stations, often far from the streets, schools and offices where people actually spend their day. Exposure changes block by block, and minute by minute.
preventable deaths every year are linked to air pollution, according to the World Health Organization.
of the world's population breathes air that exceeds WHO air-quality guideline levels.
EU transposition deadline for the new Ambient Air Quality Directive (2024/2881).
Europe is about to tighten the rules.
The EU's new Ambient Air Quality Directive must be transposed into national law by 11 December 2026 and sets stricter annual limits for 2030. Cities will need denser, more representative data on what people breathe.
Member states may request postponements in specific cases.
Stations know the area. Skyly knows the street.
A reference station is the gold standard for its location, and cities rely on it. But one station stands for a whole area, while exposure changes street by street and hour by hour. Skyly adds the layer in between: readings from where people walk, cycle and learn.
Illustration with simulated values, not measured data.
Measure. Verify. Act.
-
01
Measure
A clip-on device records nine parameters in the breathing zone: worn, carried on a bag or bike, or placed at a fixed point.
-
02
Verify
Every reading is time-stamped and tied to the device that produced it, designed to build a tamper-evident record (proof-of-sensing).
-
03
Act
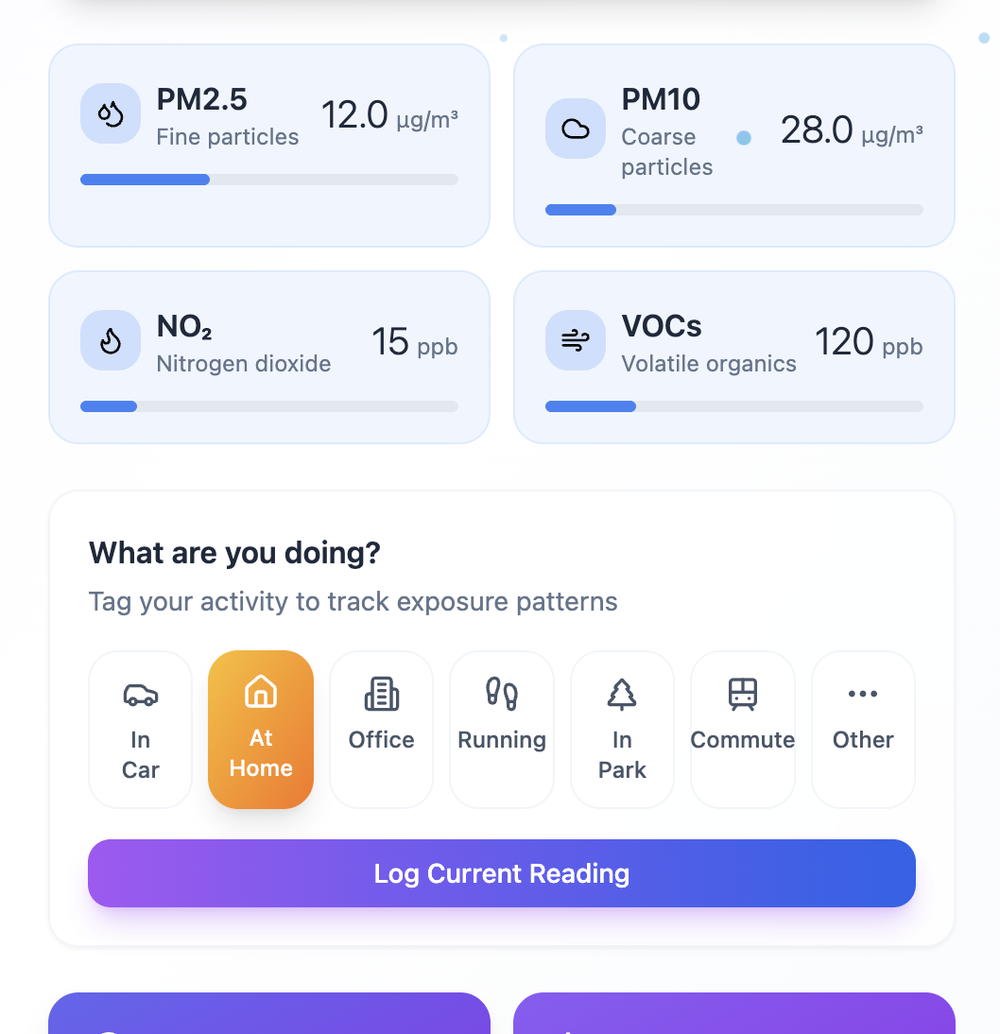
Skyly Hub turns readings into personal exposure profiles, street-level maps and data exports for people, schools, businesses and cities.
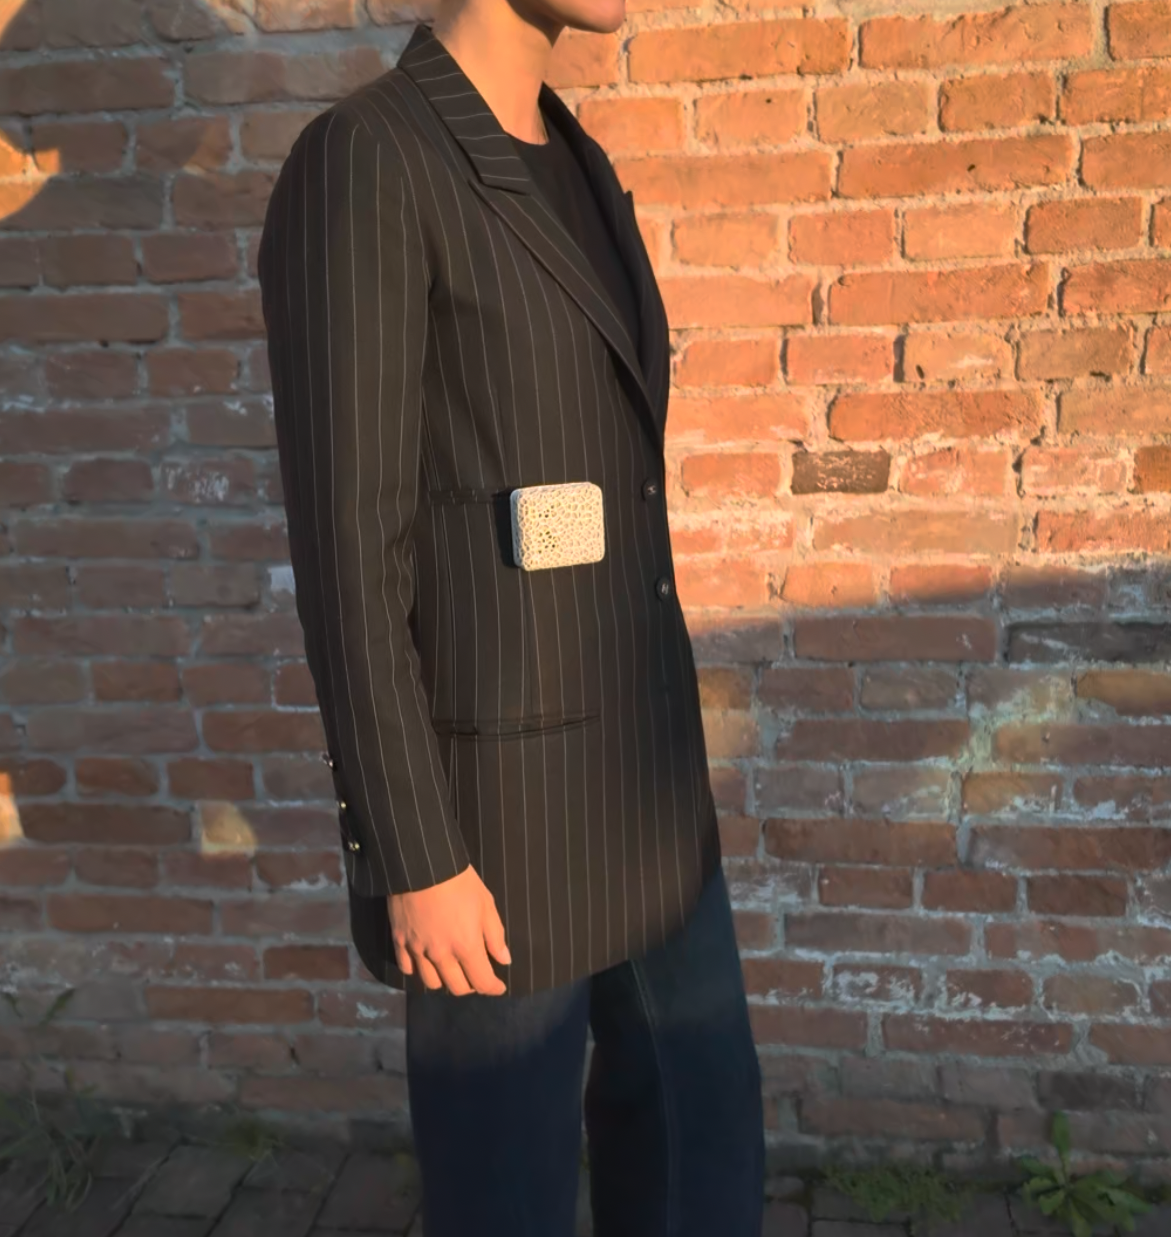
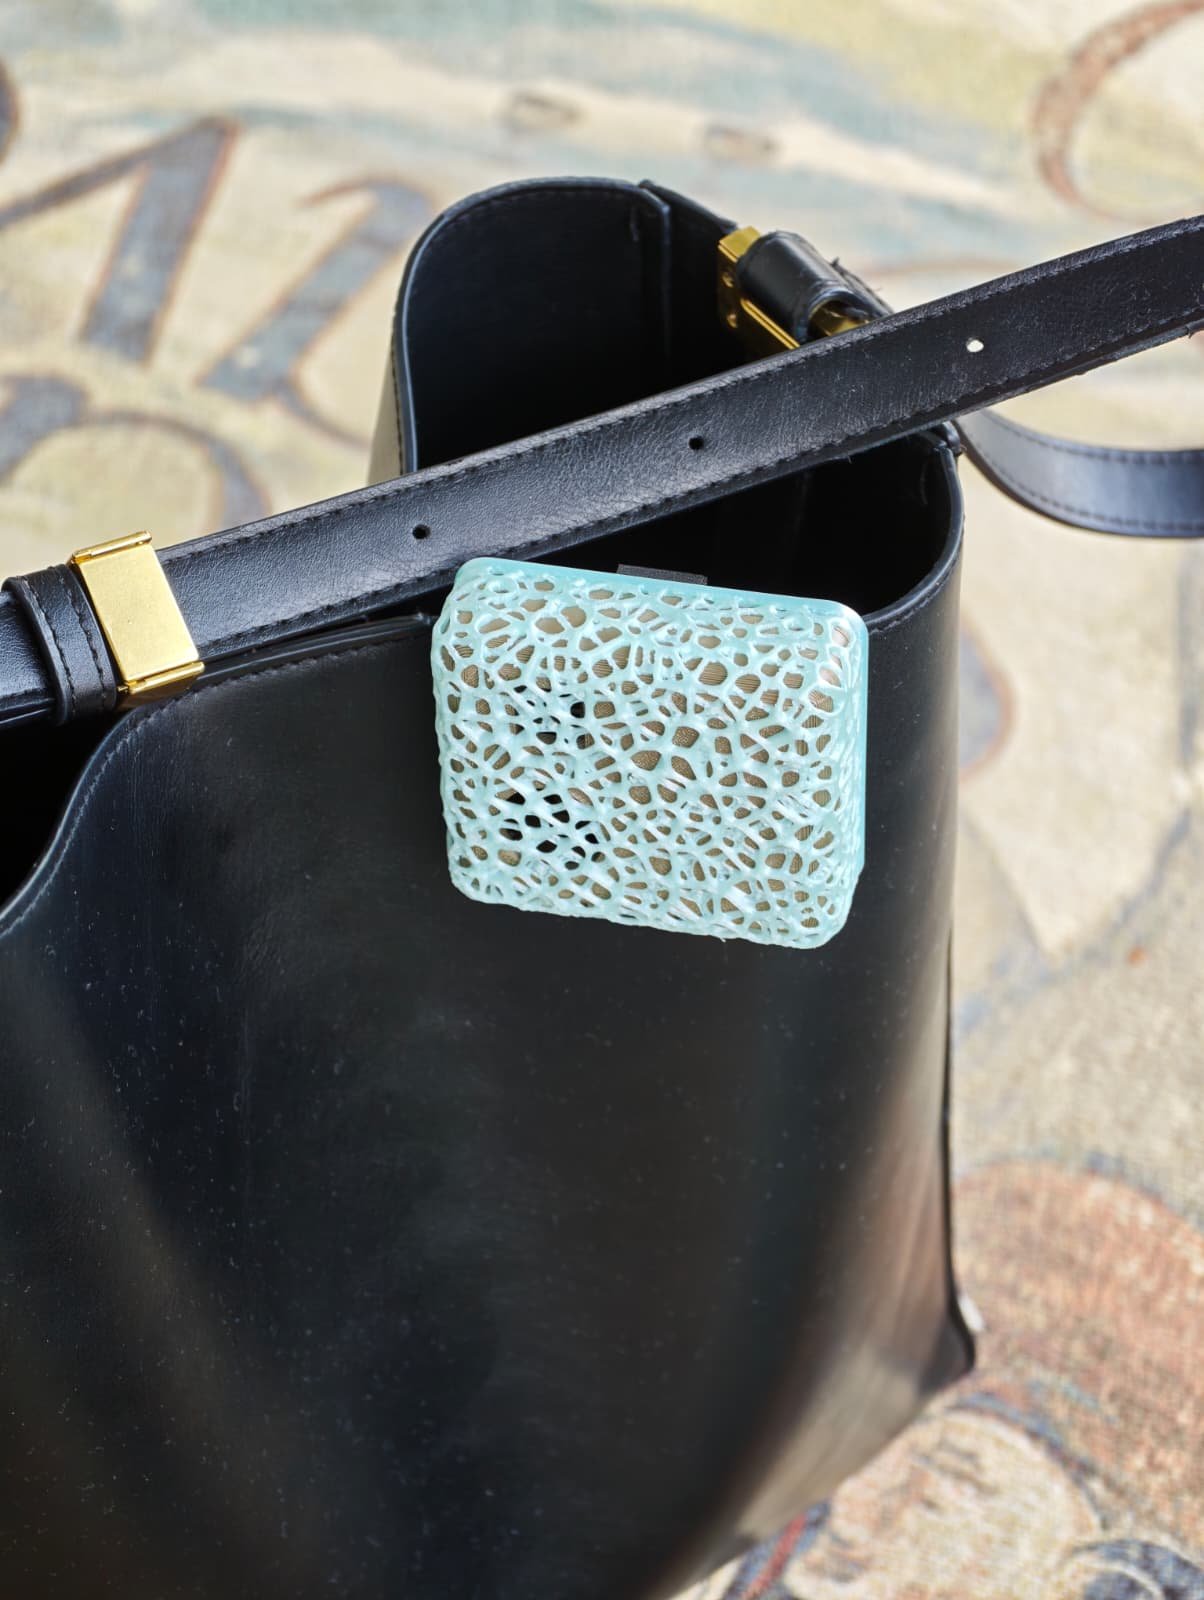
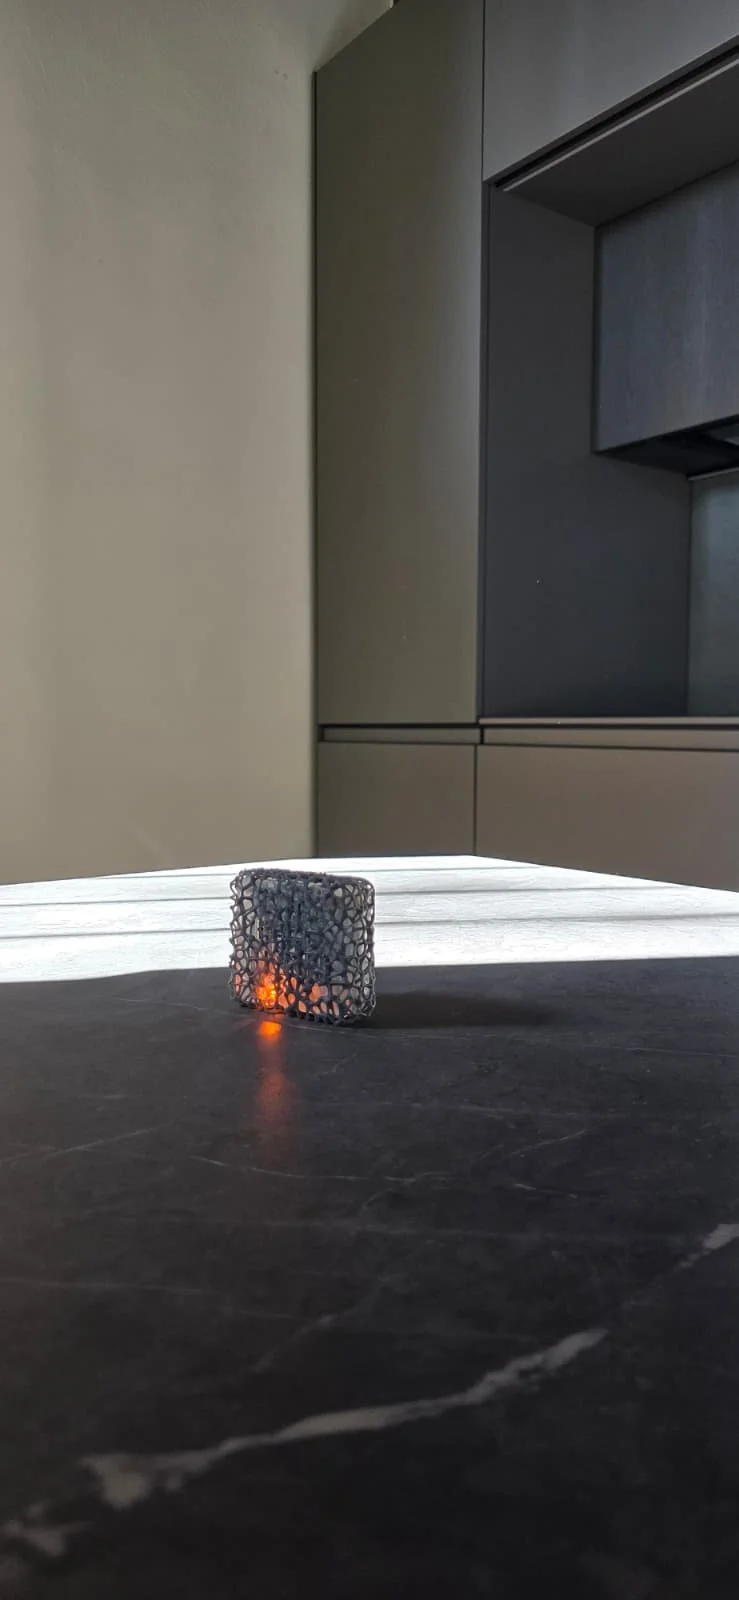
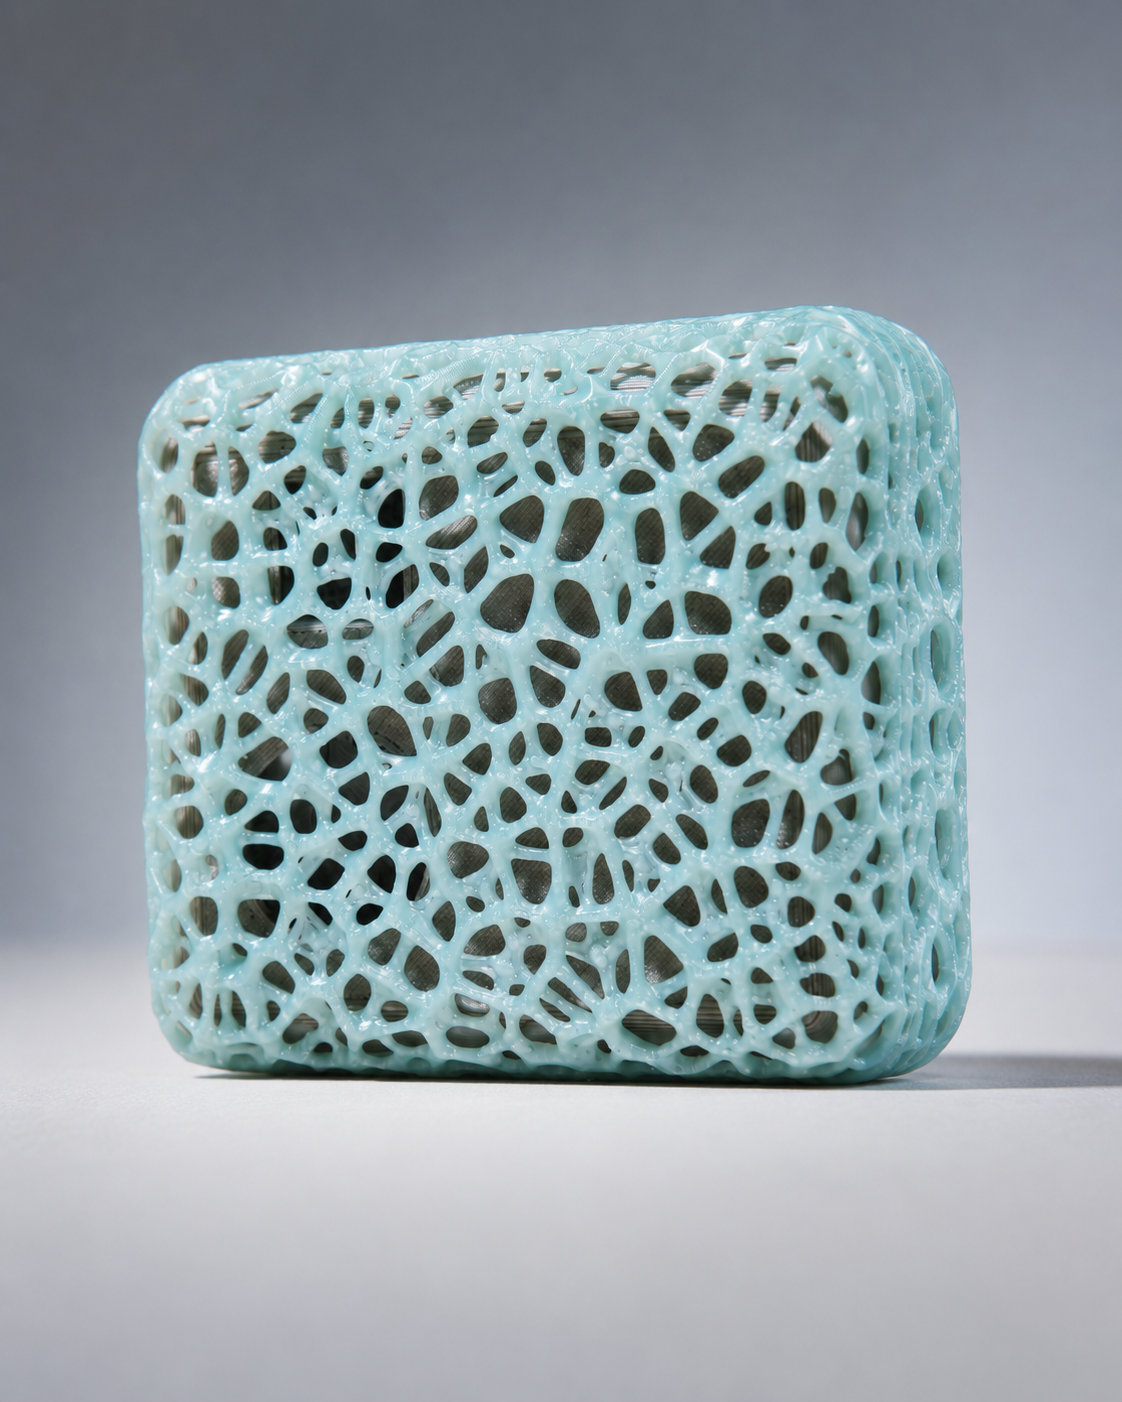
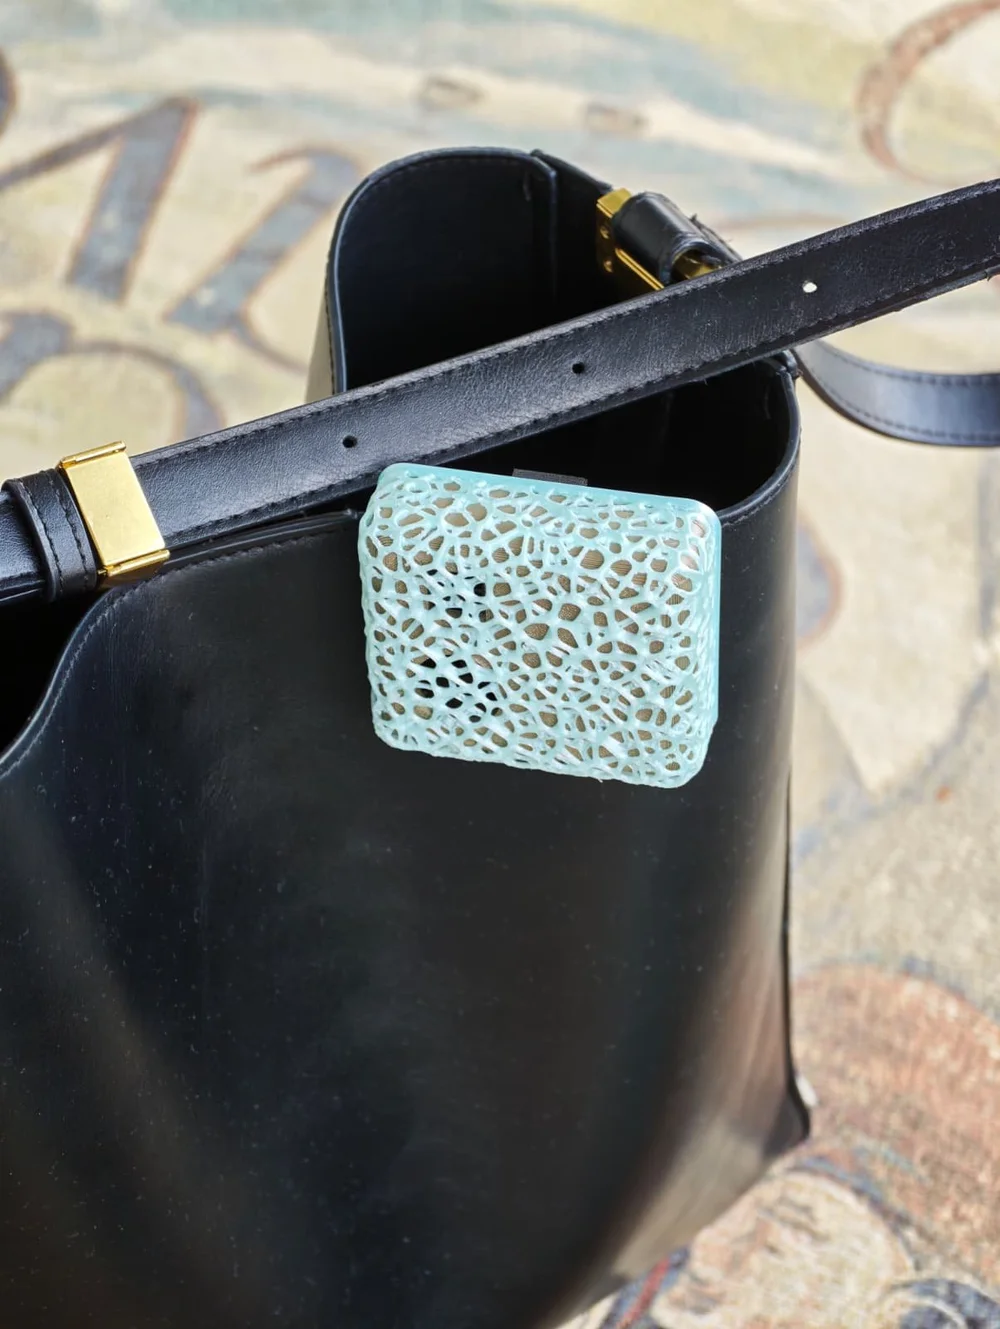
Nine parameters. One clip-on sensor.
Wear it, clip it or station it. Skyly records your real exposure as you move, and becomes a fixed monitoring node when you set it down.
- Optical laser core for particulate matter
- Built-in gyroscope that tells walking, running and stationary moments apart
- Cloud sync via Bluetooth and Wi-Fi
- Organically shaped, 3D-printed lattice case
- Protective case with integrated degasser to keep the optical core free of oxidation (in development)
Nine signals. One clear picture of your air.
Pick a parameter to see what it is, where it comes from and why it matters for your health.
Particles
Gases
Climate
PM10Coarse particles
- What it is
- Where it comes from
- Why it matters
- PM10Coarse particles up to 10 µm, from road dust, construction and wear.
- PM2.5Fine particles up to 2.5 µm that reach deep into the lungs.
- PM1Very fine particles up to 1 µm, fresh from combustion.
- VOCVolatile organic compounds from paints, cleaning products and furnishings.
- NO₂Nitrogen dioxide, a marker of road traffic.
- COCarbon monoxide, an invisible and odourless gas from incomplete combustion.
- TemperatureContext that makes every other reading interpretable.
- HumidityAffects particles, mould and comfort.
- Atmospheric pressureTells weather and altitude, and how air disperses.
Reference levels are the WHO global air quality guidelines (2021) and EU limits, shown for orientation. The panel illustrations are schematic and not to scale.
One network, three ways to use it.
A hyperlocal layer for your reference network
Map exposure street by street around schools, bus routes and construction sites, and use it alongside your existing stations through a dashboard and API.
Plan a pilot →The air your people actually breathe
Continuous, tamper-evident air-quality records for offices, sites and teams on the move, to support sustainability reporting and healthy-building programmes.
Talk to us →Know your exposure, and how to lower it
See what you breathe on your commute, at your desk and at home. Every reading also improves your city's air map.
Join the waitlist →From single readings to decisions.
Skyly Hub is the platform behind the device, built for individual and institutional users.
- Interactive dashboards of personal and group exposure
- AI-based pollution alerts
- Geolocated heat maps from mobile readings
- Data export and API access for institutions
Already in classrooms.
Our mission is to show young people what they can do, today, to improve the air of their future.
- Since January 2026High-school students learn to measure and read air-quality data with Skyly.
- Results that reached the mayorStudents' findings were brought to the attention of their city's mayor.
- Becoming part of the curriculumParticipating schools are moving to make the programme a compulsory module.
Trust is built on evidence.
Our next milestone is independent validation: placing Skyly next to reference monitoring stations and publishing how its readings compare.
- 5 yearsSensor R&DFive years of development of the sensing core.
- Jan 2026SchoolsAir-quality programme in high schools.
- 2026CompanySkyly OÜ founded; working prototype.
- NextValidationCo-location with reference stations; pilot units.
- ThenPilotsFirst city pilots and Skyly Hub v1.
Our target for the static mode is classification under CEN/TS 17660-2, the European technical specification for evaluating particulate-matter sensor systems. A rewards programme for data contributors is on our roadmap.
The people behind Skyly.
Two founders, a communication team and two engineers developing the prototype.
Founders
Asia Pozzoni
Alfio Pozzoni
With international experience in luxury and technology, Asia and Alfio decided to join forces and take on the problem of air quality, to improve what comes tomorrow.
Communication team
Shares the Skyly story with people, schools and institutions.
Prototype engineers
Two engineers developing the Skyly prototype.
Building the data layer for the air people breathe.
We are preparing our first funding round to validate the sensor against reference stations, produce pilot units and launch our first city pilots.
- Regulatory tailwindNew EU air-quality rules, transposition due by December 2026.
- Proprietary hardwareNine parameters in one wearable, three modes of use.
- Recurring revenueData and platform subscriptions for institutions.
- Built-in communityA school programme running since January 2025.
- EU companySkyly OÜ, incorporated in Estonia.
Business model
- 01 · RecurringData & platformSkyly Hub subscriptions, analytics and API for cities, businesses and institutions.
- 02 · ProductHardwareSales of the Skyly device to individuals, schools and organisations.
- 03 · EcosystemVerified dataA shared, tamper-evident air-quality dataset built with our community.
Let's talk about your air.
Cities, businesses, schools and investors: write to us and we will reply within two working days.
asiapozzoni@skyly.itSources: World Health Organization, 2022 · WHO global air quality guidelines, 2021 · Directive (EU) 2024/2881 · European Parliament summary of the Directive. Live data: contains modified Copernicus Atmosphere Monitoring Service information, via Open-Meteo.com (CC BY 4.0). Product photos show the current prototype; the 3D image is a render.